调试 Debugging
由于 Parcel 在默认情况下会自动生成源映射,因此使用 Parcel 设置调试在大多数情况下只需要很少的工作量。
Chrome 开发者工具
#假设启用了源映射,则不需要额外的配置。例如,假设您的文件夹结构如下:
src/index.html:
<!DOCTYPE html>
<html>
  <head>
    <title>Chrome Debugging Example</title>
  </head>
  <body>
    <h1 id="greeting"></h1>
    <script src="./index.ts"></script>
  </body>
</html>
src/index.ts:
const variable: string = "Hello, World!";

document.getElementById("greeting").innerHTML = variable;通过此设置,您可以运行parcel src/index.html在源代码中设置断点,如下所示:

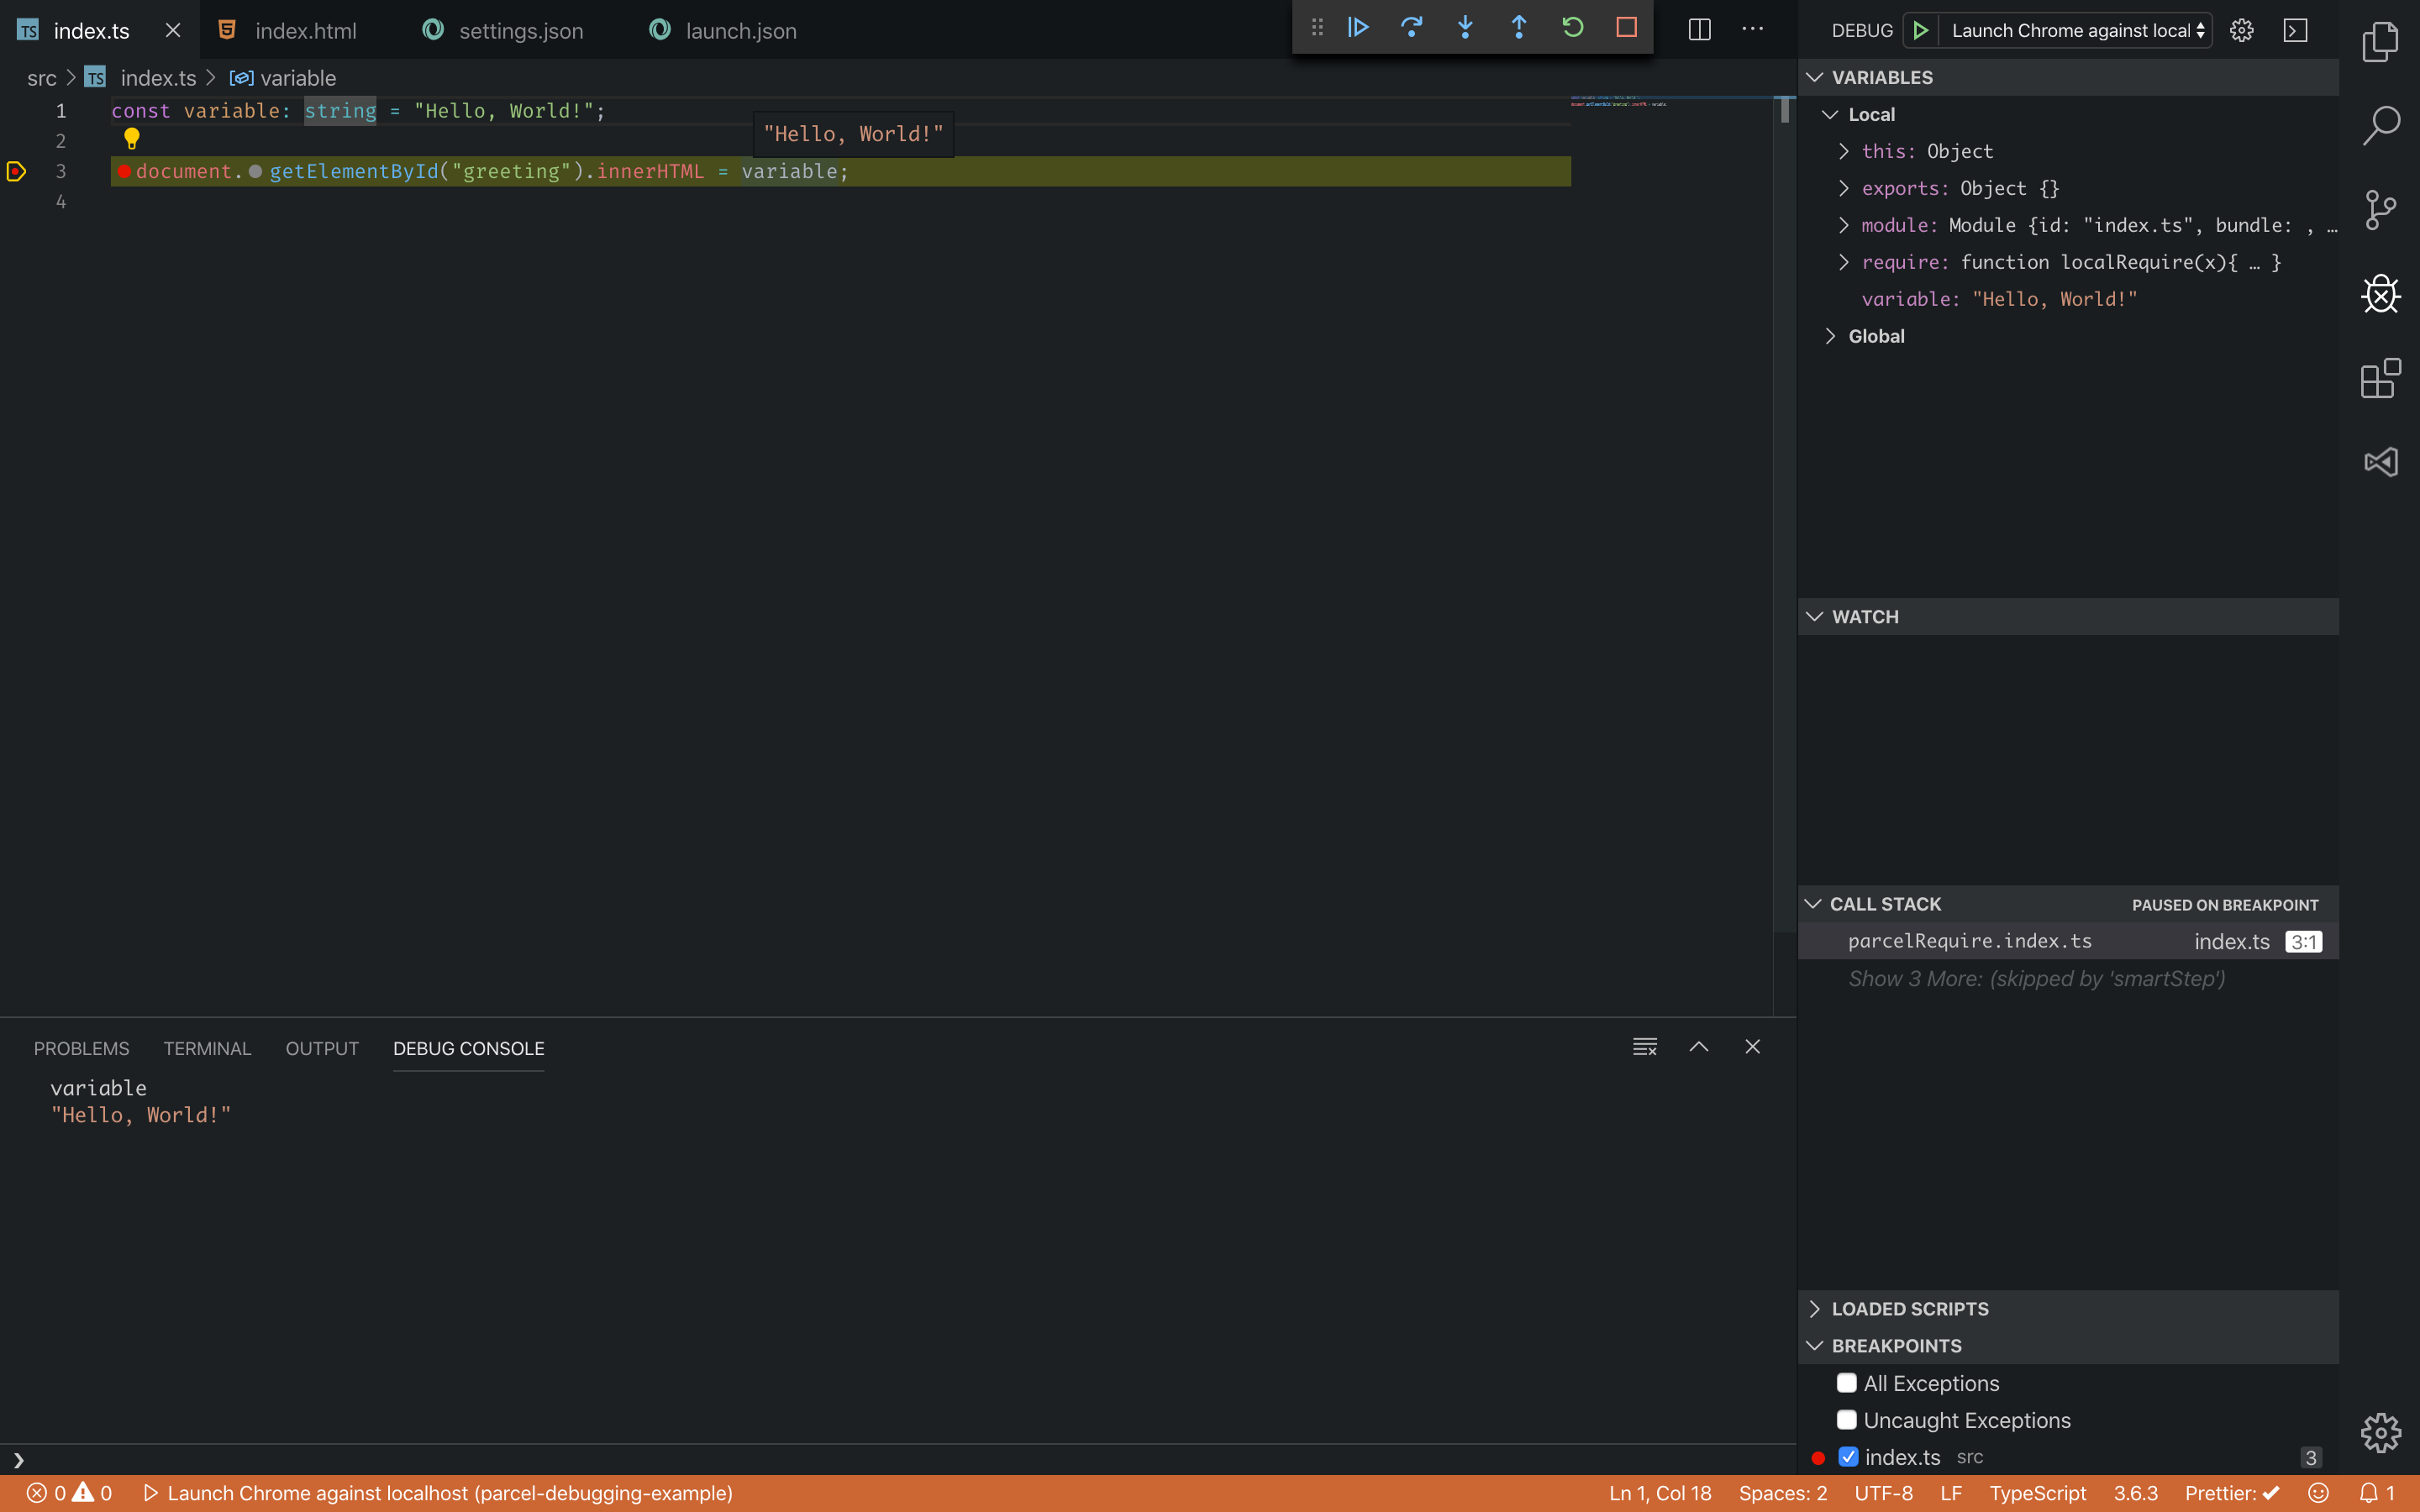
Visual Studio Code
#假设文件夹/文件结构类似于上面为 Chrome 开发者工具显示的结构,以下内容launch.json可以与Debugger for Chrome扩展一起使用:
launch.json:
{
  // Use IntelliSense to learn about possible attributes.
  // Hover to view descriptions of existing attributes.
  // For more information, visit: https://go.microsoft.com/fwlink/?linkid=830387
  "version": "0.2.0",
  "configurations": [
    {
      "type": "chrome",
      "request": "launch",
      "name": "Launch Chrome against localhost",
      "url": "http://localhost:1234",
      "webRoot": "${workspaceFolder}",
      "breakOnLoad": true,
      "sourceMapPathOverrides": {
        "/__parcel_source_root/*": "${webRoot}/*"
      }
    }
  ]
}
接下来,您需要使用您的入口点启动 parcel dev 服务器,这里是index.html:
$ parcel src/index.html
这里的最后一步是通过单击调试面板中的绿色箭头实际开始调试过程。您现在应该能够在代码中设置断点。最终结果将类似于以下内容: